SharePoint 2013 has a powerful new feature known alternately as JSLink (when working in SharePoint)and Client-Side Rendering, or CSR (in the Microsoft literature). Either way, the point is the same… this code runs on the client side, meaning after the page loads.
Client-Side Rendering is pretty straightforward, but takes a little understanding of how the JSLink functionality performs in order to get things just right.
You have two options when doing client-side rendering: a) by Item, or b) by Field within an Item. If you choose the Item route, you are going to be writing out the HTML for the entire display. This is great if you want to take the data you’re getting and display it completely differently (e.g. as an unordered list rather than a table). You will need to set the Header and Footer templates, as well.
On the other hand, if you want the presentation to remain essentially the same, but modify how specific data is highlighted, called out, or rendered, then using the Field option is better.
For our example, we’re applying client-side rendering at the Field level.
Changing the Display of Fields
For our purposes, we have three ways we want to tweak the display of the data:
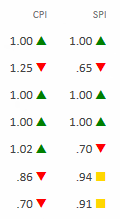
- KPIs (stoplight indicators based on index thresholds) [CPI, SPI, and TCPI, below],
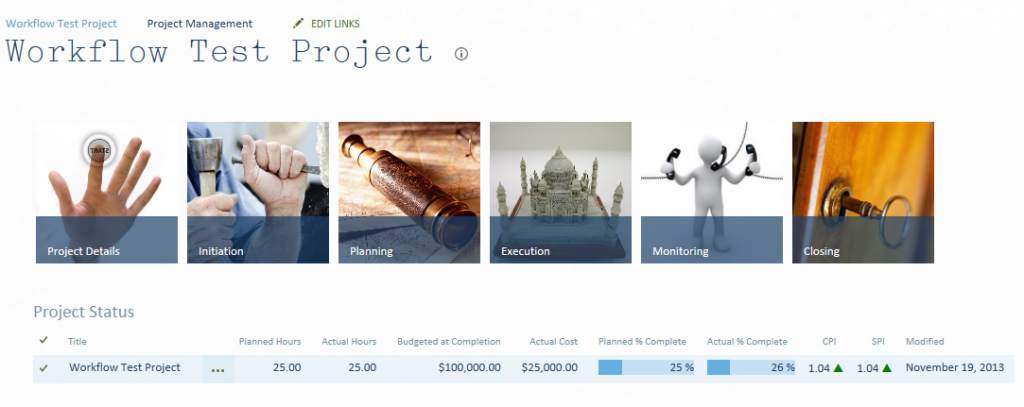
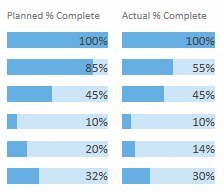
- Percentages (shown as a bar graph inline) [Planned % Complete, and Actual % Complete, below], and
- Variances (stoplight colors based on percentage variance thresholds) [CV, SV, and VAC, below].
From:
To:
Client-side rendering can be performed for four different View Templates which display the data:
- “View” – This is a list view, when multiple items are being shown, typically in a tabular format,
- “NewForm” – This is the “new item” form, used when an item is created from the list,
- “DisplayForm” – This is the form used when an item is “viewed” from the list, and
- “EditForm” – Similar to the “new item” form, it is used for editing an item.
So, 1 & 3 are view-only, for displaying the data; 2 & 4 for edit-views, allowing the user to enter new data, or edit existing data.
For simplicity, in our example, we’ll only be affecting the “View” formatting.
The Code
Here’s the code that renders the above. Next, I’ll walk through it step by step.
(function () {

//   Initialize the variables for overrides objects
	var overrideCtx = {};
	overrideCtx.Templates = {};

//   alert("Override worked");

//   Override applies only specified fields
	overrideCtx.Templates.Fields = {
        // Get KPIs for Indexes
		"CPI"        : { "View" : KPICPI },
		"SPI"        : { "View" : KPISPI },
		"TCPI"       : { "View" : KPITCPI },
		// Get graph for percentages
		"PctCompletePlanned" : { "View" : PlannedPct },
		"PctCompleteActual"  : { "View" : ActualPct },
		// Get colors for variances
		"CV"         : { "View" : VarianceCV },
		"SV"         : { "View" : VarianceSV },
		"VAC"        : { "View" : VarianceVAC }
	};

//   Register the template overrides
	SPClientTemplates.TemplateManager.RegisterTemplateOverrides(overrideCtx);

})();

function KPICPI(ctx) {
	if (ctx == null) return '';
	return getKPI(ctx.CurrentItem.CPI);
}

function KPITCPI(ctx) {
	if (ctx == null) return '';
	return getKPI(ctx.CurrentItem.TCPI);
}

function KPISPI(ctx) {
	if (ctx == null) return '';
	return getKPI(ctx.CurrentItem.SPI);
}

function getKPI(idXval) {
	var ret = idXval + '<span style="font-size: larger; color: ';
	if (idxval < .9 || idxval > 1.1) {
		ret += 'red;">▼';
	} else if (idXval > .95 && idXval < 1.05) { ret += 'green">▲';
	} else {
		ret += 'gold">■';
	}

	ret += '</span>';

	return ret;
}

function PlannedPct(ctx) {
	if (ctx == null) return '';
	var _value = ctx.CurrentItem.PctCompletePlanned != null ? ctx.CurrentItem.PctCompletePlanned : '';
	return PctField(_value);
}

function ActualPct(ctx) {
	if (ctx == null) return '';
	var _value = ctx.CurrentItem.PctCompleteActual != null ? ctx.CurrentItem.PctCompleteActual : '';
	return PctField(_value);
}

function PctField(_value) {
    var percentAsBarChart = ""; // the html to return will be built up here

    if (_value.length > 0) {
        // remove the whitespace in the % value so we can use it in CSS
        var percentageValue = _value.indexOf(" ") > -1 ? _value.replace(" ","") : "0%";
        percentAsBarChart += "
<div style='background-color: rgba(156, 206, 240, 0.5); width: 100%; position: relative;'>";
        percentAsBarChart += "
<div style='background-color: #66afe3; width: " + percentageValue + ";'> ";
        percentAsBarChart += "</div>

<span style='position: absolute; top: 0%; right: 0%;'>" + _value + "</span></div>

";
    }

    return percentAsBarChart;
}

function VarianceCV(ctx) {
	if (ctx == null) return '';
	return getVarColor(ctx.CurrentItem.CV, ctx.CurrentItem.EV);
}

function VarianceSV(ctx) {
	if (ctx == null) return '';
	return getVarColor(ctx.CurrentItem.SV, ctx.CurrentItem.EV);
}

function VarianceVAC(ctx) {
	if (ctx == null) return '';
	return getVarColor(ctx.CurrentItem.VAC, ctx.CurrentItem.CostBudgeted);
}

function getVarColor(idXval, budgVal) {
	var ret = "<span style='color: ", pctvar = math.abs(number(idxval.replace(/[^0-9\.]+/g,'')))/number(budgval.replace(/[^0-9\.]+/g,'')); if (pctvar > 0.1) {
		ret += "red";
	} else if (pctvar < 0.05) { ret += "green"; } else { ret += "gold"; } ret += ";'>" + idXval + "</span>";

	return ret;
}
Break it Down
Let’s start with the main function; then we’ll break down the steps of how this works.
This is an anonymous function that creates an override object and then registers it with the TemplateManager.
(function () {

//   Initialize the variables for overrides objects
	var overrideCtx = {};
	overrideCtx.Templates = {};

//   Override applies only to the specified fields
	overrideCtx.Templates.Fields = {
	    ...
	};

//   Register the template overrides.
	SPClientTemplates.TemplateManager.RegisterTemplateOverrides(overrideCtx);
})();
Within the Fields node itself, we’ll assign a function to each field, with the format:
"[Static Column Name]" : { "[View Template name]" : [function name] }
…like this:
overrideCtx.Templates.Fields = {
     // Get KPIs for Indexes
	"CPI"        : { "View" : KPICPI },
	"SPI"        : { "View" : KPISPI },
	"TCPI"       : { "View" : KPITCPI },

	// Get graph for percentages
	"PctCompletePlanned" : { "View" : PlannedPct },
	"PctCompleteActual"  : { "View" : ActualPct },

	// Get colors for variances
	"CV"         : { "View" : VarianceCV },
	"SV"         : { "View" : VarianceSV },
	"VAC"        : { "View" : VarianceVAC }
};
For each Field, we call a different function because we can’t pass any variables here. We’ll do that from the function. For ease of understanding and maintainability, I’ve named similar functions with similar names.
The ones that render KPI indicators are named KPI+[Static Column Name], the ones that show percentages have Pct in the name, and the variance formatting are named Variance+[Static Column Name].
So, let’s take a look at the main functions we’re calling here. The eight main ones all have a very similar structure:
function KPICPI(ctx) {
	if (ctx == null) return '';
	return getKPI(ctx.CurrentItem.CPI);
}

function PlannedPct(ctx) {
	if (ctx == null) return '';
	var _value = ctx.CurrentItem.PctCompletePlanned != null ? ctx.CurrentItem.PctCompletePlanned : '';
	return PctField(_value);
}

function VarianceCV(ctx) {
	if (ctx == null) return '';
	return getVarColor(ctx.CurrentItem.CV, ctx.CurrentItem.EV);
}
The TemplateManager will pass the entire row of data to this function, which will receive it as ctx. We’ll first check to make sure we got data in ctx; if not, we’ll return an empty string (”). Otherwise, to get the value of a specific column in the row, use the syntax ctx.CurrentItem.[Static Column Name].
For the KPIs, we simply pass the column value through our rendering function, getKPI.
For the Percentages, we’ll pass the column value through, as well, provided it’s not null—if null, we’ll pass an empty string (”) to our rendering function, PctField.
For the Variances, we’ll pass the column value through along with another value—which we’ll use for variance comparison—to our rendering function, getVarColor.
KPI Renderer
For my purposes, KPI indicators are pretty straightforward: I’m going to add a color-coded symbol next to the actual performance index, based on its proximity to the target value of 1.
If it’s within .05 either side, my indicator will be a green triangle “pointing” up. If it’s between .05 and .1 either side, the indicator will be a yellow square. Anything outside that will be red. The easiest way to check for those thresholds is to look for values outside the .1 threshold and make those red, then look for values within the .05 threshold and make those green, all other values will be yellow.
Remember from our main function that we’re simply passing the KPI value through; getKPI will receive it as idXval.
function getKPI(idXval) {
	var ret = idXval + " <span style='font-size: larger; color: ";
 	if (idxval < .9 || idxval > 1.1) {
 		ret += "red;'>▼";
	} else if (idXval > .95 && idXval < 1.05) { ret += "green'>▲";
	} else {
		ret += "gold'>■";
	}

	ret += "</span>";

	return ret;
}
In this function we append our color-coded HTML to the value we passed in, then send that back to the template in the return value. Done.
Percentage Renderer
I wish I could remember where I got the HTML to display the percentage as a bar within a bar (div within a div, really), but just rest assured that I didn’t come up with this on my own (if I find my original source, I’ll update this post giving credit where credit is definitely due).
First remember that we’re passing in either a percentage value or an empty string, which PctField will receive as _value. We’re building up an HTML string that will contain our value, but will also show our value by setting the width of the inner div to match it.
Percentage Example
It’s important to note that _value is a string that looks like this: “X %” (It’s a number value, then a space, and the percent sign.) HTML doesn’t play well with spaces in percentages, so we need to strip that out for percentageValue which is used for the width setting of the inner bar, even though we leave the space in place for the display value.
Like the KPI Renderer, we build up the HTML and send it back to the template in the return value. If an empty string was passed in, an empty string will be passed back to the template.
function PctField(_value) {
    var percentAsBarChart = ""; // the html to return will be built up here

    if (_value.length > 0) {
        // remove the whitespace in the % value so we can use it in CSS
        var percentageValue = _value.indexOf(" ") > -1 ? _value.replace(" ","") : "0%";
        percentAsBarChart += "
<div style='background-color: rgba(156, 206, 240, 0.5); width: 100%; position: relative;'>";
        percentAsBarChart += "
<div style='background-color: #66afe3; width: " + percentageValue + ";'></div>

";
        percentAsBarChart += "<span style='position: absolute; top: 0%; right: 0%;'>" + _value + "</span></div>

";
    }

    return percentAsBarChart;
}
Variance Renderer
Last but not least, our Variance renderer shows how close we are to our budget by getting dividing our passed value by our passed budget value. Unlike the KPIs, the closer the variance is to 0, the better. Since our variance could be negative, we’ll take the absolute value of our calculation and check it against our thresholds of .1 and .05.
The values we’re passing in will be dollar values, so we want to strip out everything but numerals and decimals before converting them to numbers for our calculations, hence the regular expression to replace everything else with an empty string: idXval.replace(/[^0–9\.]+/g,“”)
function getVarColor(idXval, budgVal) {
	var ret = '<span style="color: ', pctvar = math.abs(number(idxval.replace(/[^0-9\.]+/g,'')))/number(budgval.replace(/[^0-9\.]+/g,'')); if (pctvar > 0.1) {
 		ret += 'red';
 	} else if (pctvar < 0.05) { ret += 'green'; } else { ret += 'gold'; } ret += ';">' + idXval + '</span>';

	return ret;
}
In this case, we’re not doing anything with the HTML except setting the color, so we build up a span tag for that purpose and wrap it around our value, and pass it back to the template.
If you want to use this same code to affect the display on the DisplayForm, you’ll need to indicate that on each Field, like so:
"CPI"        : { "View" : KPICPI,
                 "DisplayForm" : KPICPI},
Since the Edit- and NewForms display input fields, you would want to create the renderer for those a little differently.
Applying Our Renders to the List View
To put this code into place, first save the above code in a file and save it to the Style Library at the site collection (so you can use it throughout the site collection). I prefer to save mine in a scripts folder.
Once it’s saved, we simply edit the list view page, then edit the web part:
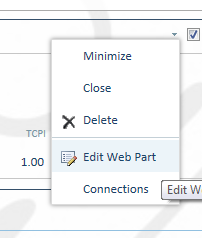
Edit Web Part to implement JS Link code on the view
In the Miscellaneous section, enter the path to the your file (~sitecollection/Style Library/scripts/colorHTML.js) in the JS Link box:
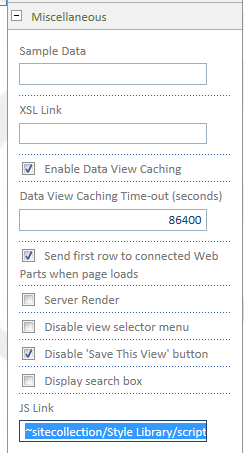
Enter in JS Link:~sitecollection/Style Library/scrips/colorHTML.js
Click OK, and then Stop Editing, and you’re done.
If your rendering doesn’t show immediately after editing the page, refresh and it should show. If it still doesn’t, you may have an error in your code that you’ll need to track down.


Discussion
Trackbacks/Pingbacks
[…] JSLink for KPI’s […]